Mkphlist generates a faked photon list of an X-ray source from the spectral energy distribution and photon flux provided. It can also simulate an extended source by giving an X-ray image of the source. You need to give a spectral distribution file produced with xspec, photon flux (photon/s/cm2), and the source coordinates for a point source and a FITS image for a extended source. Xissim can read up to eight photon lists produced with mkphlist, so that you can simulate multiple point and/or extended sources by running mkphlist several times.
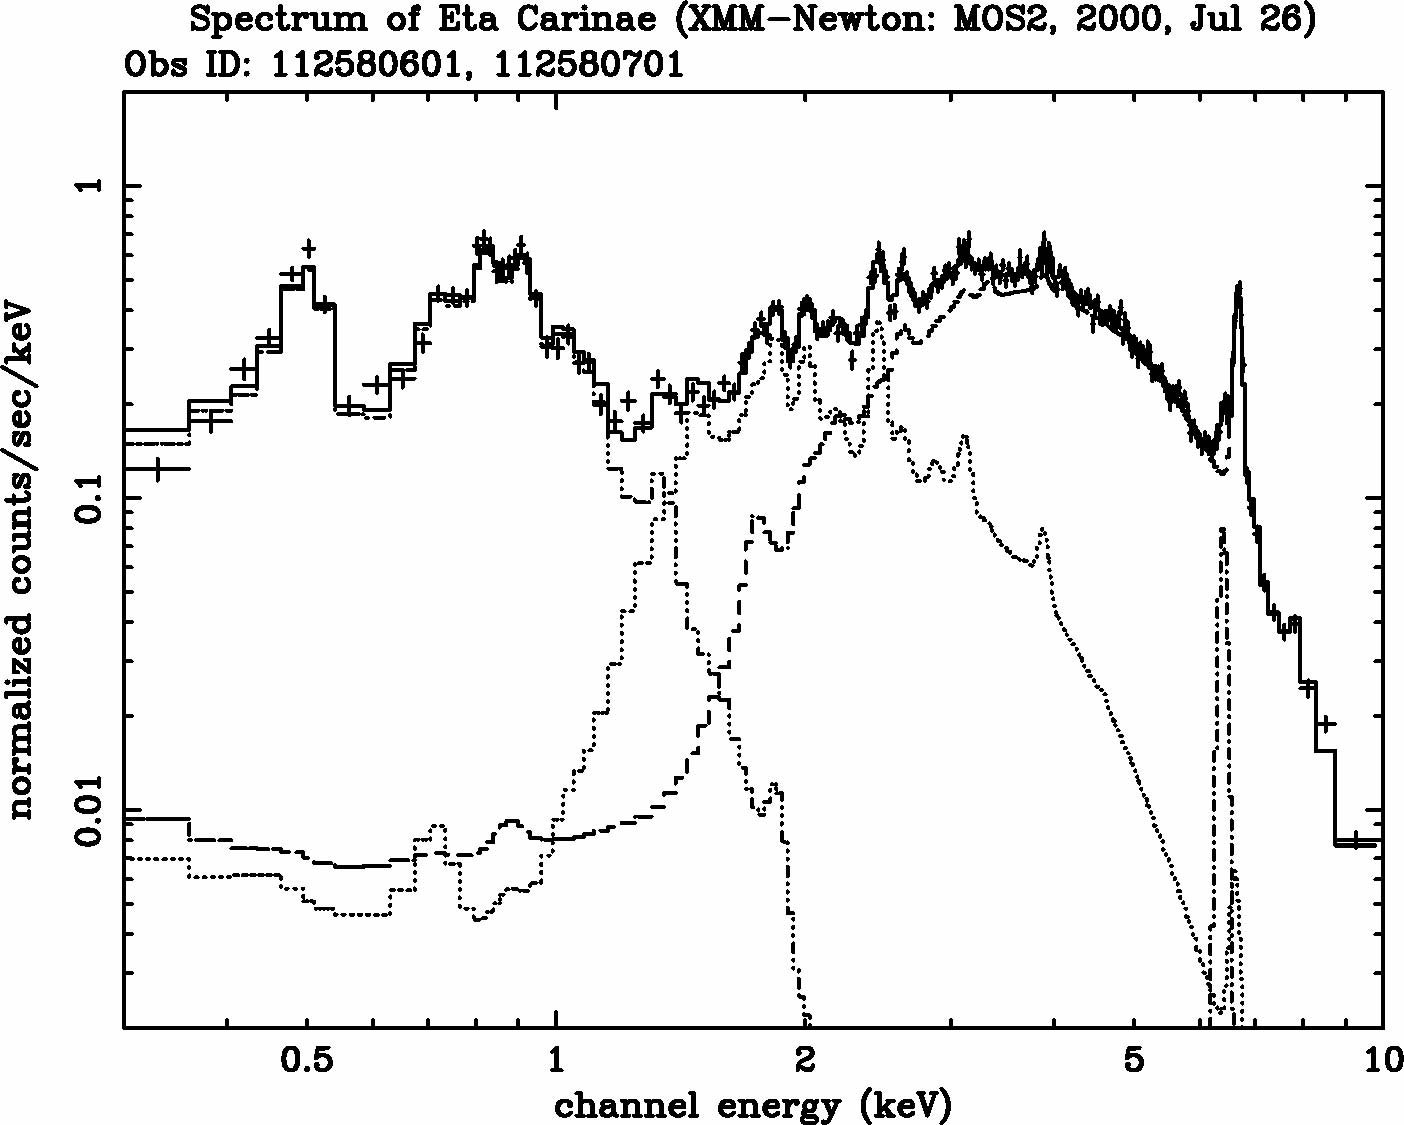
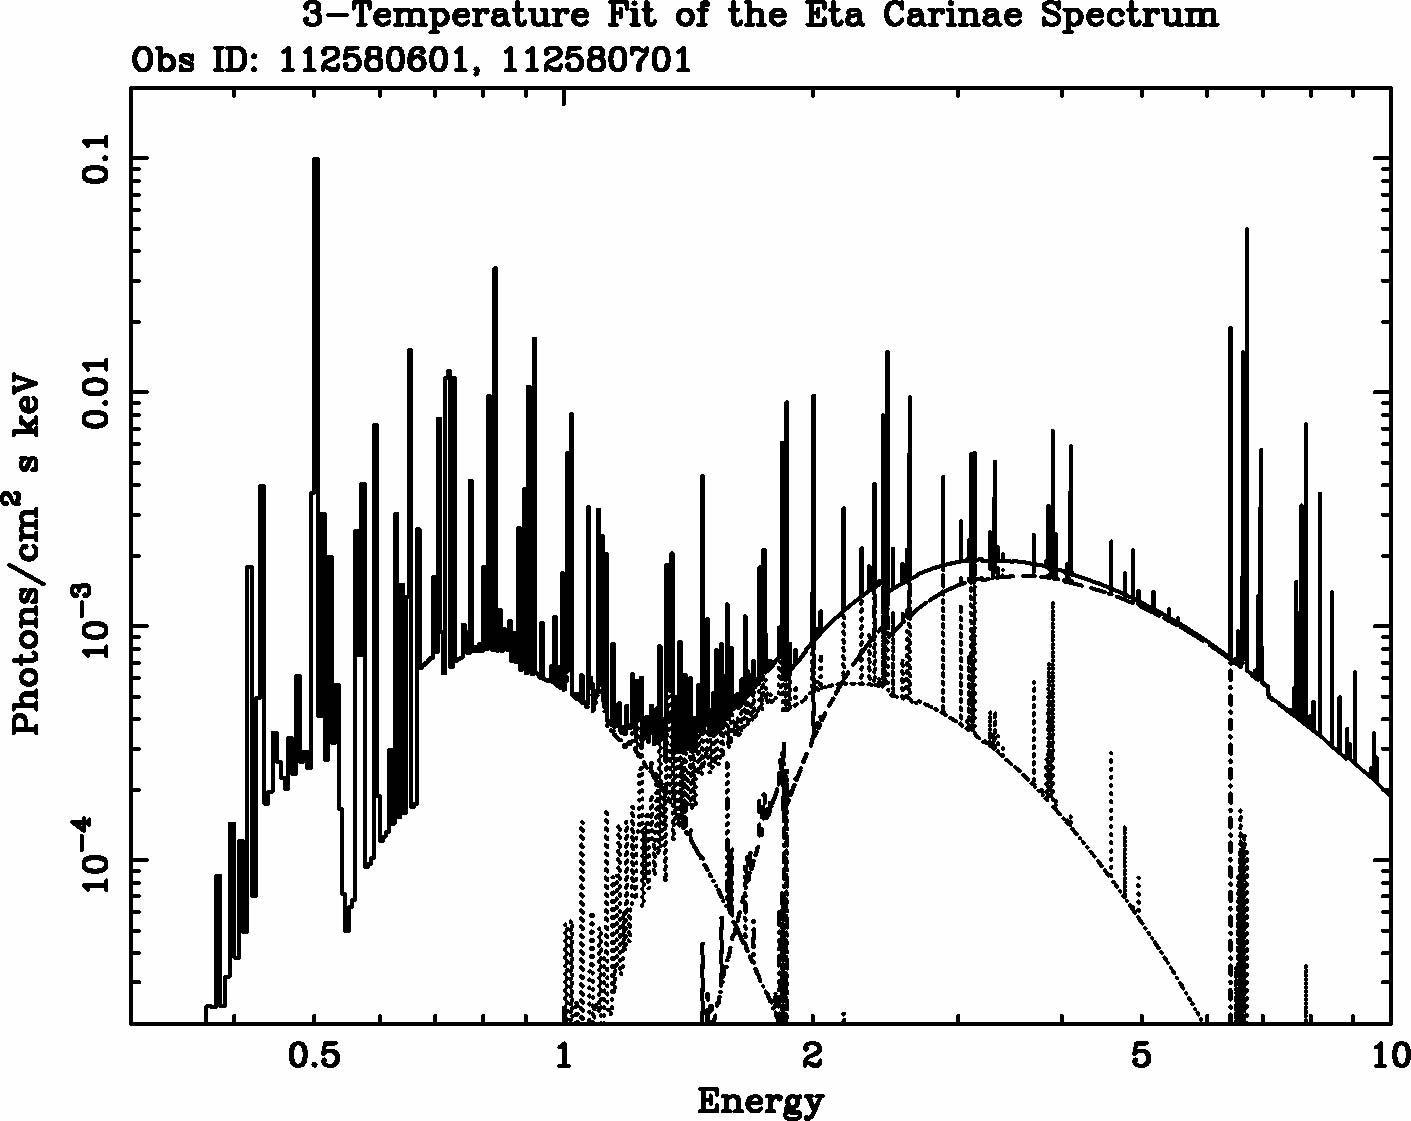
Here, we take again an example of an Eta Carinae observation. For the simulation, we use a spectral model derived from a spectral fit of the same XMM-Newton data (ID: 112580601). The model assumes absorbed 3 temperature plasma components with a Gaussian line at 6.4 keV. For simplicity, we assume all emission comes from a point source though the soft emission is actually extended. In the figure below, the left panel shows the data plotted with the fitting model and the right panel shows the same model with the physical unit at the vertical axis, which we use for the input of mkphlist.
After the spectral fit on xspec, we first measure the
photon flux. You can choose an arbitrary band width to measure it. Here
we take the energy band between 0.5-10 keV.
XSPEC>flux 0.5 10
Model flux  1.1242E-02 photons ( 7.1102E-11 ergs)cm**-2 s**-1 (  0.500- 10.000)
We then call the PLT command line inside xspec to generate a table of the spectral model.
XSPEC>pl modelThis command generates two QDP files, etacar_spec_model.qdp for the data table and etacar_spec_model.pco for PLT commands. mkphlist uses "etacar_spec_model.qdp".
XSPEC>iplot
PLT> we etacar_spec_model
We now simulate a Suzaku observation for 50 ksec. Then, we run mkphlist with the option like this.
mkphlist photon_flux=1.1242E-02 flux_emin=0.5 flux_emax=10.0 spec_mode=0 \
qdp_spec_file=etacar_spec_model.qdp image_mode=1 ra=161.2650 dec=-59.6845 \
time_mode=1 limit_mode=1 exposure=50000 outfile=etacar.photon
The output FITS file etacar.photon contains a faked photon list with the photon arrival time, energy and direction in the sky coordinates (In this case, the R.A. and Dec. of Eta Carinae. The first 5 rows of the photon list in etacar.photon are shown here.
If you want to simulate an extended source, the command options are like this.
mkphlist photon_flux=0.4486 flux_emin=0.3 flux_emax=12 spec_mode=0 \
qdp_spec_file=casa_spec_model.qdp image_mode=0 \
fits_image_file=hrcf01505N004_full_img2.fits time_mode=1 limit_mode=1 \
exposure=50000 outfile=casa.photon